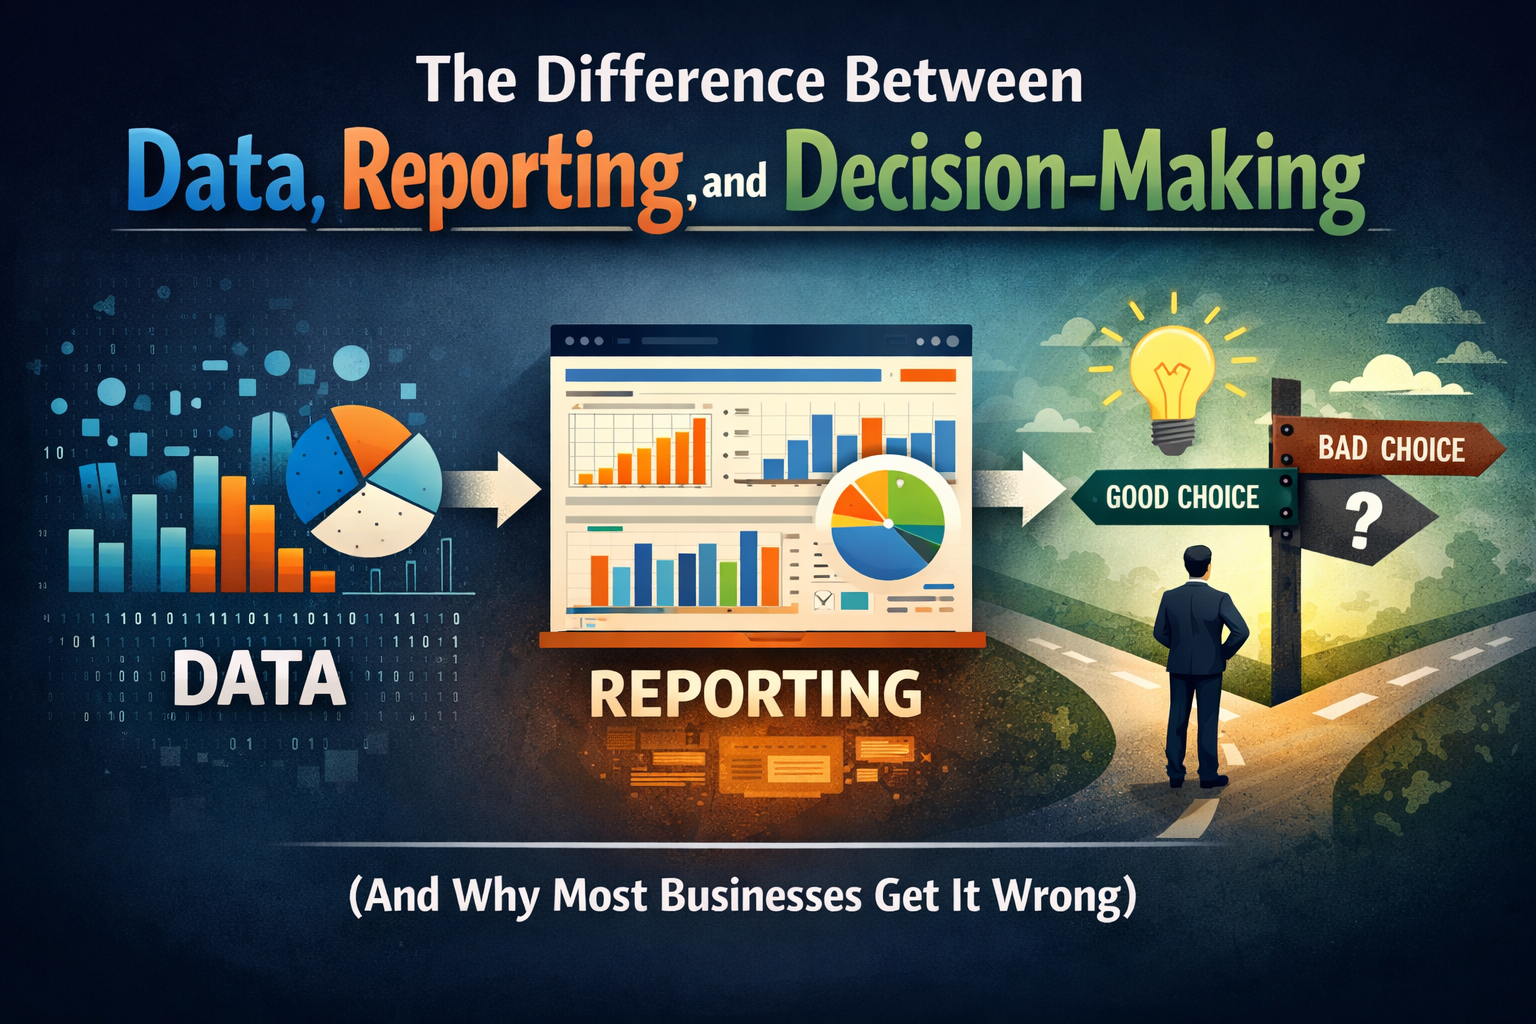
The Difference Between Data, Reporting, and Decision-Making (And Why Most Businesses Get It Wrong)

Many organizations believe they are data-driven.
They have dashboards. They generate reports. They track metrics. On the surface, everything looks structured and informed.
But when it comes to making decisions, teams still rely on instinct, incomplete information, or long internal discussions.
This disconnect is more common than most companies realize.
The issue is not a lack of data—it’s a misunderstanding of the difference between data, reporting, and decision-making, and how they should work together.
Organizations that get this wrong invest heavily in tools but see little improvement. Those that get it right turn information into action—and gain a real competitive advantage.
Why This Matters More Than Ever
Businesses today generate more data than ever before.
From customer behavior and operational workflows to financial performance and marketing activity, nearly every part of an organization produces measurable information. At the same time, analytics tools have become faster, cheaper, and easier to implement.
Dashboards can be built in days. Reports can update in real time.
Yet despite all of this, many organizations still struggle to answer basic questions:
- Are we actually performing well?
- Where are we losing efficiency?
- What should we do next?
The problem isn’t access to information—it’s lack of structure and alignment.
When data, reporting, and decision-making are not clearly connected, organizations don’t become data-driven—they become data-overloaded.
Instead of clarity, they get noise. Instead of speed, they get delays. Instead of confidence, they get debate.
The Three Layers Explained
To fix this, it’s important to understand the three layers clearly.
1. Data — The Raw Input
Data is the foundation. It includes everything your business collects:
- Sales transactions
- Website activity
- Operational metrics
- Customer interactions
- Financial records
On its own, data doesn’t provide answers—it only reflects what has happened.
A spreadsheet full of numbers may look valuable, but without context or structure, it doesn’t tell you what’s working or what needs to change.
This is where many organizations make their first mistake: they assume that more data equals better decisions.
In reality, more data often creates more confusion.
Teams spend time pulling reports, cleaning spreadsheets, and reconciling numbers across systems—without actually improving outcomes.
Data creates potential-but not clarity.
2. Reporting — Making Data Understandable
Reporting is the process of organizing data into usable formats.
This includes:
- Dashboards
- Charts and visualizations
- KPI tracking systems
- Performance summaries
Reporting answers key questions:
- What happened?
- How are we performing over time?
- Where are we above or below target?
For example, a dashboard might show:
- Monthly revenue trends
- Customer acquisition cost (CAC)
- Conversion rates
- Operational efficiency metrics
This layer is essential because it creates visibility.
But visibility alone is not enough.
Many organizations stop here. They build dashboards, track metrics, and assume they are data-driven.
In reality, they’ve only made their data easier to look at—not easier to act on.
A report shows you the situation. It does not make a decision.
3. Decision-Making — Where Value Is Created
Decision-making is where insight turns into action.
This is the layer that actually impacts performance.
It answers:
- What should we do next?
- Where should we allocate resources?
- What actions will improve outcomes?
Examples include:
- Adjusting marketing spend based on rising CAC
- Fixing bottlenecks in an operational workflow
- Reallocating resources toward higher-performing products
- Changing pricing or strategy based on trends
This step requires more than data—it requires context, prioritization, and ownership.
It also requires alignment with business goals.
Without a clear decision-making process, even the best data and reporting systems fail to deliver results.
Data creates potential. Reporting creates visibility. Decision-making creates results.
A Simple Example: Where Things Break Down
Consider a typical company running paid marketing campaigns.
They have:
- Detailed dashboards tracking cost, conversions, and ROI
- Weekly reports shared across teams
- Clear visibility into performance
But when customer acquisition costs increase, nothing happens.
Why?
Because:
- No one is responsible for deciding what to change
- There is no defined threshold for action
- Teams debate instead of act
Now compare that to a structured approach:
- If CAC increases by 15%, campaigns are reviewed within 48 hours
- A defined owner is responsible for optimization
- Predefined actions are taken (adjust targeting, reallocate budget, test creatives)
Same data. Same reporting.
Different outcome.
The difference is decision structure.
Where Most Businesses Go Wrong
Many organizations blur the lines between these layers—and assume they are interchangeable.
This leads to predictable problems.
1. Confusing Reporting with Action
Dashboards are treated as the end goal rather than a tool.
Teams spend time reviewing metrics but leave meetings without clear next steps.
2. Over-Investing in Tools
Companies adopt new analytics platforms, BI tools, or AI solutions without defining how decisions will improve.
Technology becomes a substitute for strategy.
3. Lack of Ownership
No one is clearly responsible for turning insights into action.
Data teams report. Leadership reviews. Execution stalls.
4. Too Many Metrics
Tracking everything creates noise.
Without prioritization, teams cannot focus on what actually drives performance.
5. Delayed Decision Cycles
When decisions rely on meetings, approvals, or manual analysis, organizations move slowly—even when data is available in real time.
What High-Performing Organizations Do Differently
High-performing organizations treat data, reporting, and decision-making as connected but distinct systems.
1. They Start With Decisions
Instead of starting with dashboards, they ask:
- What decisions do we need to make better?
- What outcomes are we trying to improve?
This creates focus from the beginning.
2. They Design Reporting Around Action
Every report exists for a reason.
It highlights:
- Key drivers of performance
- Areas that require attention
- Signals that trigger action
If a report doesn’t lead to a decision, it’s reconsidered.
3. They Build a Clean Data Foundation
They ensure data is:
- Consistent
- Centralized
- Reliable
This reduces confusion and builds trust across teams.
4. They Define Decision Frameworks
They make decision-making explicit:
- Who owns the decision
- What triggers action
- What actions should be taken
This removes ambiguity and speeds up execution.
5. They Embed Data Into Daily Operations
Data is not reviewed occasionally—it is used continuously.
Teams make small, ongoing adjustments instead of waiting for major reviews.
Where AI Fits In
AI is becoming a powerful layer in modern operations—but it is often misunderstood.
Many organizations try to apply AI at the data or reporting level, expecting it to create immediate value.
The real impact of AI comes at the decision layer.
AI can:
- Identify patterns humans might miss
- Predict future outcomes
- Recommend next-best actions
- Automate routine decisions
For example:
- Forecasting demand to optimize inventory
- Automatically adjusting pricing based on conditions
- Routing customer inquiries based on likelihood of conversion
However, AI is not a shortcut.
It depends on:
- Clean, structured data
- Clear reporting systems
- Defined decision processes
Without these, AI produces noise instead of value.
AI doesn’t replace decision-making—it scales it.
How to Improve Your Approach
Improving your organization’s use of data doesn’t require a complete overhaul. It starts with alignment.
1. Audit Your Current System
Map out how information flows:
- Where is data coming from?
- How is it reported?
- How are decisions currently made?
Look for gaps between insight and action.
2. Simplify Your Metrics
Focus on a small number of KPIs that directly impact performance.
Clarity is more valuable than volume.
3. Connect Reports to Decisions
For every dashboard or report, ask:
What decision does this support?
If there is no clear answer, it may not be necessary.
4. Assign Ownership
Every key metric or report should have a clear owner responsible for acting on it.
Ownership drives accountability.
5. Create Repeatable Systems
Move away from one-off analysis.
Build systems where:
- Signals trigger actions
- Decisions are consistent
- Improvements compound over time
Final Thoughts
Data, reporting, and decision-making are not the same thing.
They are three layers of a system:
- Data → shows what happened
- Reporting → explains it
- Decision-making → improves it
Most businesses stop at reporting.
The ones that succeed go further—they turn insight into action.
They build systems where:
- Data is reliable
- Reporting is clear
- Decisions are consistent and timely
In today’s environment, that capability is no longer optional.
It is what separates organizations that analyze from those that execute.