Why Most Operations Dashboards Fail Before AI Can Fix Them

Most business dashboards are built with a simple promise: give leaders visibility, and they will make better decisions. In theory, that sounds right. In practice, many dashboards end up ignored, misunderstood, or trusted only when they confirm what someone already believes.
That is why so many operations teams are turning to AI and advanced analytics. But there is a problem: AI does not automatically fix a broken dashboard. If the underlying data is messy, the KPIs are poorly chosen, and the reporting workflow does not match how people actually make decisions, then AI simply makes the same problem faster and more visible.
The real issue is not that dashboards are obsolete. The real issue is that most dashboards were never designed to support real operational decisions in the first place.
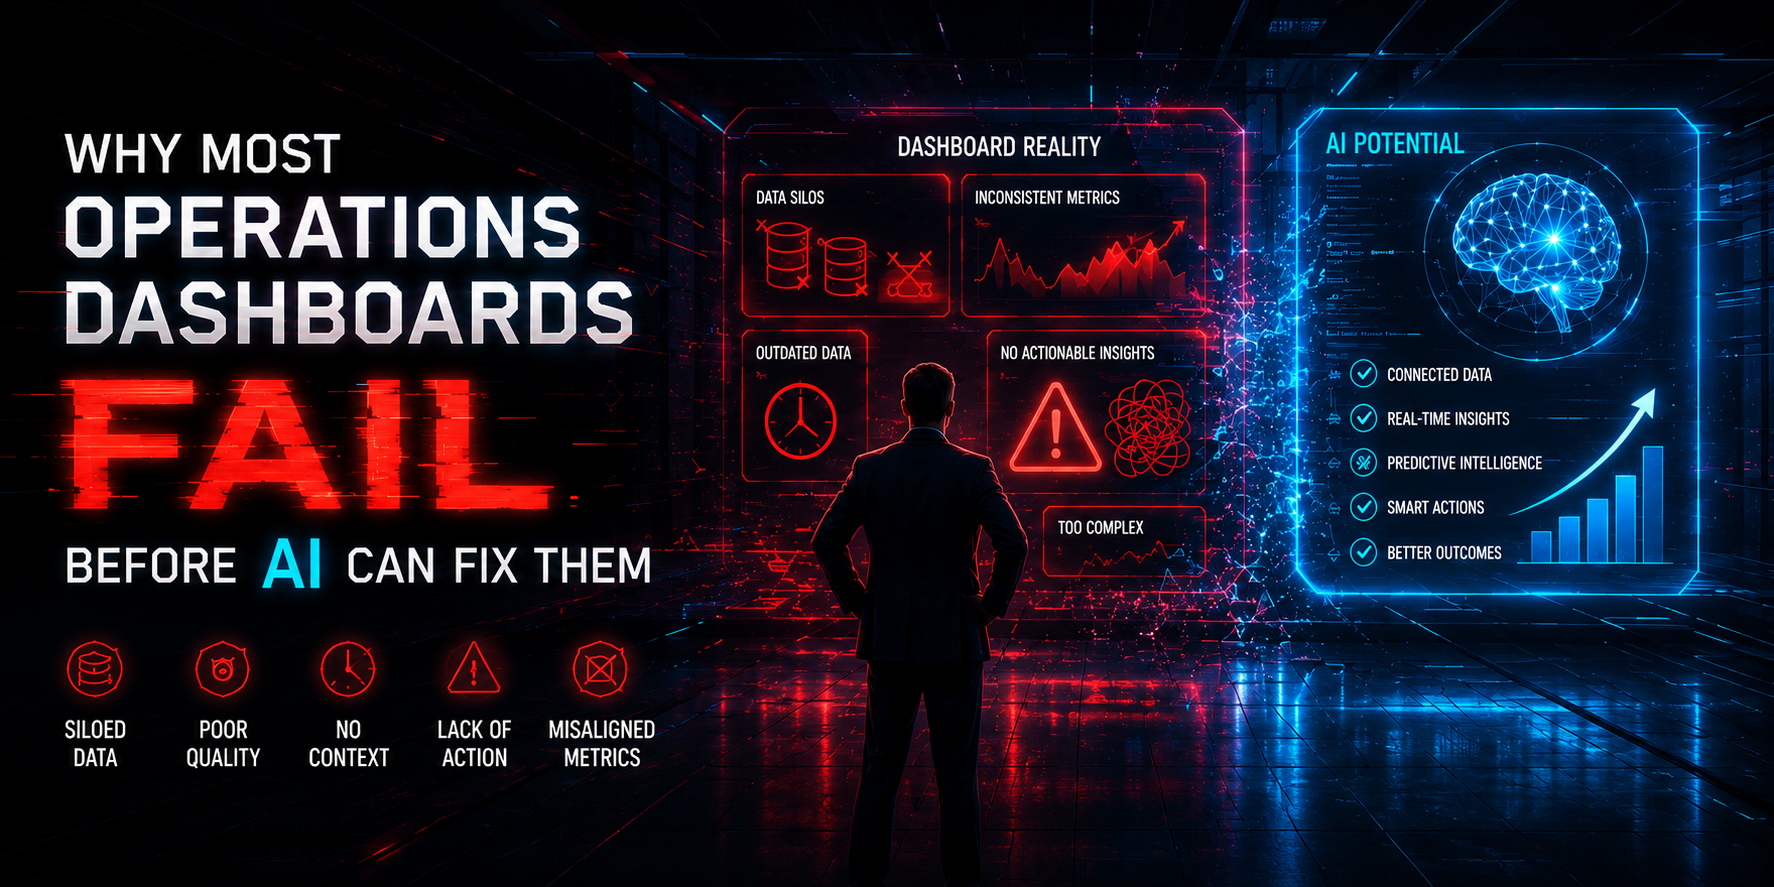
Dashboards usually fail for a few predictable reasons
The first reason dashboards fail is that they often track too many metrics. When every chart is labeled “important,” nothing is truly important. Leaders end up staring at a wall of numbers without knowing what action to take.
The second reason is poor metric selection. Many dashboards focus on what is easy to measure instead of what actually matters. A report may show website traffic, calls answered, tickets closed, or units produced, but those figures do not always explain whether the business is healthy. If a metric does not connect to a decision, it becomes decoration.
The third reason is inconsistent data. If one department defines “completed order” differently from another, or if updates arrive late, then the dashboard becomes a source of confusion instead of clarity. People stop trusting the numbers, and once trust is gone, the dashboard loses its value.
The fourth reason is that dashboards often answer the wrong question. Executives do not just want to know what happened. They want to know why it happened, what will happen next, and what action they should take. A static dashboard can show the past, but it rarely explains the path forward.
AI is not a magic fix
A lot of companies assume AI will solve these problems automatically. It will not.
AI can help identify patterns, surface anomalies, forecast demand, and highlight unusual changes much faster than manual reporting. It can also make dashboards feel more interactive by allowing users to ask questions in plain language. But AI still depends on the quality of the data, the clarity of the business rules, and the usefulness of the underlying process.
If the business is feeding in poor data, AI will still generate poor insights. If the dashboard is built around vanity metrics, AI will just help people explore the wrong things more efficiently. In other words, AI improves the delivery of insight, but it does not replace the need for good operational design.
This is where many organizations get stuck. They think the tool is the solution, when the real issue is the operating model behind the tool.
What executives actually need
Executives rarely want more charts. They want confidence.
A useful operations dashboard should answer a small set of questions very clearly:
- Are we on track?
- Where is the problem?
- How urgent is it?
- What is likely to happen next?
- What should we do now?
If a dashboard cannot answer those questions quickly, it is probably not serving its purpose. Good dashboards reduce cognitive load. They highlight exceptions, trends, and priorities rather than forcing leaders to interpret every detail themselves.
This is why many of the best dashboards are surprisingly simple. They use a few carefully chosen KPIs, clean visual hierarchy, and clear definitions. They do not try to impress people with complexity. They try to help people act.
The hidden cost of bad dashboards
A bad dashboard is not just annoying. It is expensive.
When leaders do not trust the data, they ask for manual reports. When managers do not understand the numbers, they waste time in meetings debating definitions. When teams cannot see the real bottlenecks, they respond too late or fix the wrong thing. Over time, the organization builds workarounds around the dashboard instead of using it.
That creates three major problems. First, decisions slow down. Second, operational waste increases. Third, the company loses confidence in its own reporting systems.
In many businesses, the dashboard becomes a ritual rather than a tool. It gets reviewed because it exists, not because it changes behavior. That is a sign that the dashboard is not supporting the business; the business is supporting the dashboard.
AI-ready operations start with better foundations
Before AI can improve operations analytics, the business needs a stronger foundation. That foundation has four parts.
First, data definitions must be consistent. Everyone needs to agree on what each metric means, how it is calculated, and where it comes from. If those rules are unclear, no amount of AI will create a reliable reporting environment.
Second, the business must focus on operational outcomes, not just activity. It is not enough to track how much work is being done. Leaders need to know whether the work is producing value.
Third, the reporting system should be designed around decisions. Every KPI should have a clear owner and a clear action associated with it. If no one knows what to do when a metric changes, the metric is probably not very useful.
Fourth, the organization needs clean data pipelines. AI tools are only as strong as the systems feeding them. Bad inputs will produce weak forecasts, misleading patterns, and false confidence.
When these foundations are in place, AI becomes much more valuable. It can identify trends earlier, flag risks sooner, and support faster decisions. Without them, AI is just a layer of technology on top of broken reporting.
What a better dashboard looks like
A better operations dashboard is built for action.
It starts with a small number of meaningful KPIs. These indicators should reflect the real health of the business, not just the volume of activity. They should be easy to understand and tied to operational goals.
It also uses visual design to guide attention. The most urgent issues should stand out immediately. Trend lines should show whether performance is improving or declining. Benchmarks should make it easy to see whether the business is above or below target.
A strong dashboard also separates monitoring from exploration. The main view should answer the most important questions quickly. Deeper analysis should be available for users who need to investigate root causes. That way, the dashboard is both simple and flexible.
Most importantly, it should support decision-making. A good dashboard does not just tell you what happened. It helps you decide what to do next.
Why this matters more in 2026
In 2026, organizations are under pressure to make faster decisions with fewer resources. At the same time, leaders are expecting more from analytics tools. They want less manual work, more automation, and more insight delivered in context.
That is why the old dashboard model is breaking down. A static monthly report is no longer enough. Businesses need systems that can detect problems early, explain changes clearly, and guide action in real time.
AI will absolutely play a bigger role in that future. But the companies that benefit most will not be the ones that simply add AI features to a weak dashboard. They will be the ones that fix the reporting foundation first.
That means better data, better definitions, better workflows, and better ownership of the metrics that matter.
How to improve your own dashboard
If your current dashboard is not working well, start with these questions:
- Which decisions is this dashboard supposed to support?
- Which metrics actually influence those decisions?
- Do all teams define those metrics the same way?
- Do leaders trust the data enough to use it?
- Can someone see the main issue within 10 seconds?
- Does the dashboard show what happened, or only what was measured?
If you cannot answer those questions clearly, the dashboard needs more than a redesign. It needs a rethink.
That does not always mean starting over. Sometimes the solution is to remove clutter, fix data quality, simplify KPIs, or build separate views for different audiences. In other cases, it may mean redesigning the entire reporting model around business decisions instead of departmental reporting.
The key is to treat the dashboard as a decision tool, not a display tool.
Final thoughts
Most operations dashboards fail because they were built to report activity, not to drive decisions. AI can make analytics more powerful, but it cannot rescue a dashboard that lacks clear metrics, clean data, and a connection to real business outcomes.
The organizations that will win in 2026 are the ones that understand this distinction. They will stop asking for more charts and start asking better questions. They will build dashboards that support action, not just observation. And they will use AI to strengthen a system that already works, rather than hoping technology can fix a broken one.
If you want your operations analytics to deliver real value, start with the foundation. The dashboard is only useful when it helps people make better decisions faster.